Farm updates · Oilseed rape · Povey Farm · Satellite imagery · Winter barley
An eye on our crops—from space
29 October 2026 · Moss Valley Fine Meats
With autumn drilling finished at Povey Farm, our attention turns to how the young crops are getting established. That means walking the fields, looking closely at the plants—and taking a look from rather further away.
Satellite imagery gives us another view of our fields here in the Moss Valley. Alongside photographs taken with our boots on the ground, these colourful maps help us build a picture of how the crops are developing.
What do the colours mean?
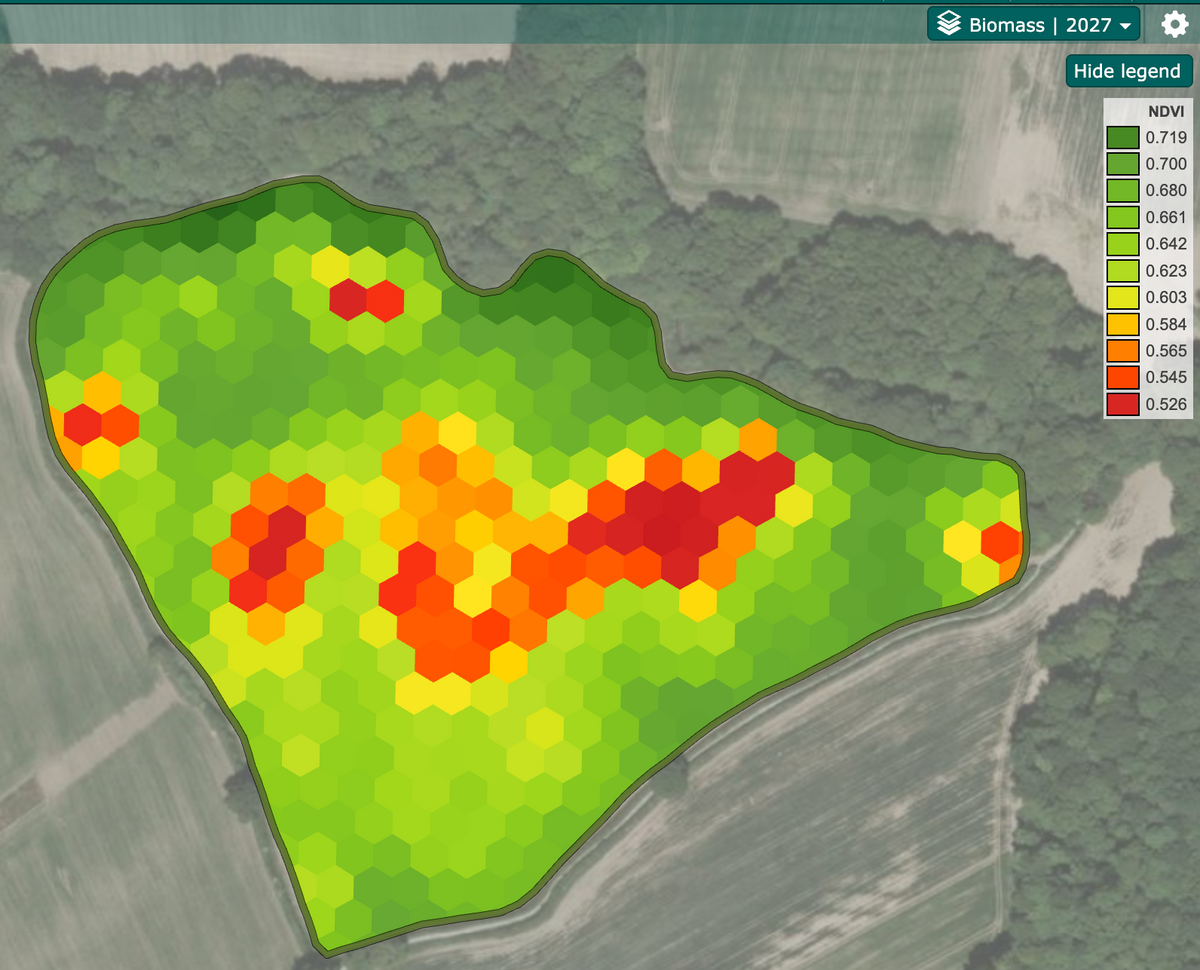
These maps use a measure called NDVI, which picks up differences in the light reflected by vegetation. Put simply, it gives an indication of how green and leafy the crop cover is across a field.
On these maps, darker green represents higher readings, while yellow, orange and red show lower readings. A red patch does not automatically mean a crop has failed. It highlights a difference worth looking at more closely, rather than telling us the cause.
Big Storth: our winter barley
The map below shows our winter barley in Big Storth. Much of the field appears green, with a band of lower readings through part of the middle and a few smaller patches elsewhere.

This is where a map becomes useful alongside a walk through the crop. Differences in plant numbers, growth stage and soil conditions are among the things we can investigate. The map alone cannot tell us which explanation applies.

A different view of our oilseed rape
Our oilseed rape map shows a different pattern, with much of the mapped area green and some lower readings around field edges and in patches within the crop.

Each map has its own colour scale. The same shade of green does not necessarily mean the same reading in both pictures, so they should not be treated as a competition between the barley and the rape.

29 October: autumn nutrition applied
Today we applied our autumn Bionature nutrition to the winter wheat in Long Storth and the winter barley in Big Storth. The wheat is at the three-leaf stage, while the barley is beginning to produce side shoots, known as tillers.
The barley application included NHK Delta, Leodita and 1-4-All. Our aim with the autumn nutrition programme is to support root development and crop establishment ahead of winter.
We will keep checking how the crops develop through field walks and future satellite images. These maps give us a useful record of variation across the fields, but they cannot on their own show whether a nutrition treatment has worked.
The whole field and the individual plant
A satellite can show patterns across a whole field, but it cannot replace lifting a plant, checking its roots or feeling the soil. Putting those observations together helps us decide what needs attention and what to keep watching as the season progresses.
It is another part of the work behind our family farm: following the crops from sowing through to harvest, learning from what we see and making decisions as the season unfolds.
We will share more from the fields as the crops grow. In the meantime, you can read our autumn drilling update for a look at how this season began.